When we look at the earthquake evidence for Plate Tectonics, one amazing feature is the Benioff Zoned earthquakes that show the dipping of one plate under another and then into the mantle.
When an earthquake occurs it is measured by scientists and data is collected about the following;
Location (in latitude and longitude).
Strength (in magnitude) and
Depth (in kilometers – because metric is awesome :p )
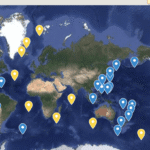
When all this data is plotted on a map we see very distinctive patterns around our planet. The vast majority of earthquakes occur in zones that we now recognize as the boundaries between tectonic plates. These are locations where slabs of the lithosphere (the crust and top hard part of the mantle) are bumping, grinding, and sliding past each other.

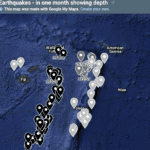
But not all these zones are the same. Some zones are thinnish lines and some zones are wide black smudges on the map.
This is where the DEPTH of the earthquake comes into play. Scientists group earthquakes into the following depths:
Shallow earthquakes are between 0 and 70 km deep;
Intermediate earthquakes are 70 – 300 km deep;
Deep earthquakes are 300 – 700 km deep.
If we look at the thin zones we notice that all the earthquakes are shallow.
If we look at the wide zones we see that the earthquakes are shallow on one side, intermediate depth in the middle and deep on the other side.

If you want to get your classroom a map showing these zones around the world, get this one: USGS This Dynamic Earth. You can download a digital copy which you can use on laptops and tablets.
This zoning phenomenon is now commonly known as the Benioff Zone (sometimes the Wadati-Benioff Zone). Victor Benioff was an American scientist who dedicated many years of his life to better understanding the earthquakes around the Pacific Ocean and in particular those deep earthquakes and how they related to the deep ocean trenches. You can read all about Benioff here.
The Benioff Zone of earthquakes is caused by the subduction of one tectonic plate under another. The earthquakes at the surface boundary between the two plates are shallow. The subducted plate is forced down deeper causing intermediate earthquakes and as it is forced into the mantle it continues to produce earthquakes (deep earthquakes) until the plate finally is reabsorbed into the mantle at around 700 km or so.

The earthquake data acts as a ‘sonogram’ of what is happening at the plate boundary. If we plot the data on a graph showing earthquake depth against distance we almost can see the shape of the plate being forced down into the mantle. Where the earthquakes stop at depth is where the plate becomes so soft that no sudden movements (ie rocks grinding) can be detected. Here the plate is being reabsorbed into the mantle.

So these Benioff Zones of earthquakes provide evidence that plates are interacting in these areas on Earth. And they provide us evidence for the shape of plates as they are being subducted!
More Plate Tectonics information…

Writing Prompts

Microfossils
Shale – and how we use it.
Sandstone – quartz, arkose and lithic

Apparent Polar Wandering & Plate Tectonics
Seismic Shadow

Seeing Inside the Earth

Tectonic Plates – Lithosphere, Moho, Asthenosphere
Plate Tectonics Battleships
Earth’s Plate Tectonic Features – ld
World Earthquakes by Depth – LD

Divergent Dilemma
What is the history of the theory of Plate Tectonics?

What are the mechanisms that drive Plate Tectonics?

Seeing inside the Earth

Earth’s Interior Layers

Earth’s layers explained

Plate Tectonics Google Map
Benioff Zones – earthquake evidence for subduction
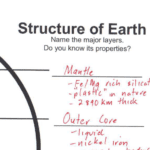
Structure of Earth

Volcano shapes – shield, composite/stratiform, caldera – and chemistry
Transform fault plate boundaries – what are their features?
Convergent plate boundaries – subduction, collision and Island arcs – what are their features?
Divergent plate boundaries – what are their features?
The Evidence for Plate Tectonics
Earth’s Magnetic Reversals, Polar Wandering and Plate Tectonics

Earthquakes – what you need to know!
Introduction to Plate Tectonics
Lava in Lihue – Role play activity
Rocks of Ages

Evidence for Plate Tectonics

Boundaries – how the plates interact

Plates – understanding the tectonic jigsaw pieces.

The Earth’s Crust – a simple way to view it.